 Feedback form
 I am interested in the idea of learning analytics. I want to gather data about student learning and progress to influence what they are learning and what I teach next.
Rather than just continue to read more about it I decided to try it out with my new Year 11 Software Design and Development class. I chose this class as I knew nothing about these students and students normally come in with vastly different skills and knowledge.
I decided to collect data by getting my students to complete a weekly feedback/reflection on their learning and my teaching using use a Google Form (I am using Google forms/spreadsheets because they seem like a good tool to collect and analyse the data and it will force me to learn how to use them).
As well as showing me how the students are progressing, I am hoping the data will provide me with information about my "teaching" each week and will enable the students to reflect on their learning. From this data I am hoping to identify students at risk/struggling/bored/engaged and to adapt my lessons to met their needs.
I spent time researching questions that would collect a range of data about each student's progress and be quick to complete. I wanted to gather data about:
- their level of engagement in the course/class
- their understanding/knowledge of the content covered
- their understanding of what they were required to learn
- whether the work was hard or easy
- their (overall) level of happiness/confidence in the course
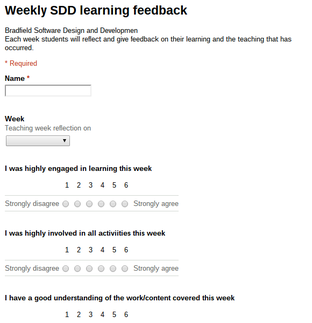
I used the likert scale of 1-6 (strongly agree to strongly disagree). I also gave students opportunities to write comments (which would force them to reflect on what they have covered/learnt). You can check out the (live) feedback sheet bit.ly/sddfeedback
Once the students complete the form it populates a Google Spreadsheet (see sample below), you can also quickly create cool graphs of the data (see samples below).
Rather than just continue to read more about it I decided to try it out with my new Year 11 Software Design and Development class. I chose this class as I knew nothing about these students and students normally come in with vastly different skills and knowledge.
I decided to collect data by getting my students to complete a weekly feedback/reflection on their learning and my teaching using use a Google Form (I am using Google forms/spreadsheets because they seem like a good tool to collect and analyse the data and it will force me to learn how to use them).
As well as showing me how the students are progressing, I am hoping the data will provide me with information about my "teaching" each week and will enable the students to reflect on their learning. From this data I am hoping to identify students at risk/struggling/bored/engaged and to adapt my lessons to met their needs.
I spent time researching questions that would collect a range of data about each student's progress and be quick to complete. I wanted to gather data about:
- their level of engagement in the course/class
- their understanding/knowledge of the content covered
- their understanding of what they were required to learn
- whether the work was hard or easy
- their (overall) level of happiness/confidence in the course
I used the likert scale of 1-6 (strongly agree to strongly disagree). I also gave students opportunities to write comments (which would force them to reflect on what they have covered/learnt). You can check out the (live) feedback sheet bit.ly/sddfeedback
Once the students complete the form it populates a Google Spreadsheet (see sample below), you can also quickly create cool graphs of the data (see samples below).
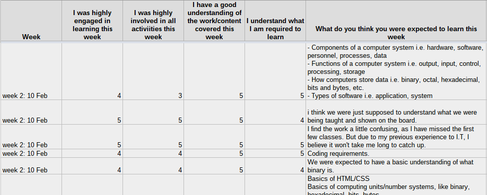 Populated Google Spreadsheet
 I have the data for the first week. My initial thoughts were:
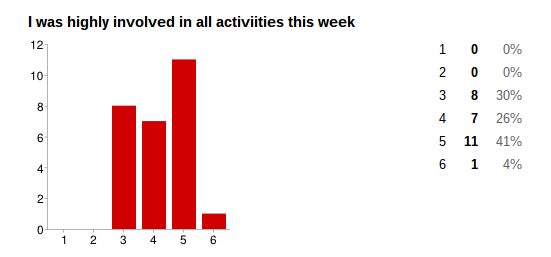
1. I was not totally happy with how I taught in the first week as I thought I did too much talking/directed teaching and the data reflected this with many students indicating they were not engaged in the learning activities, with 50% scoring 3's and 4's (see first graph below)
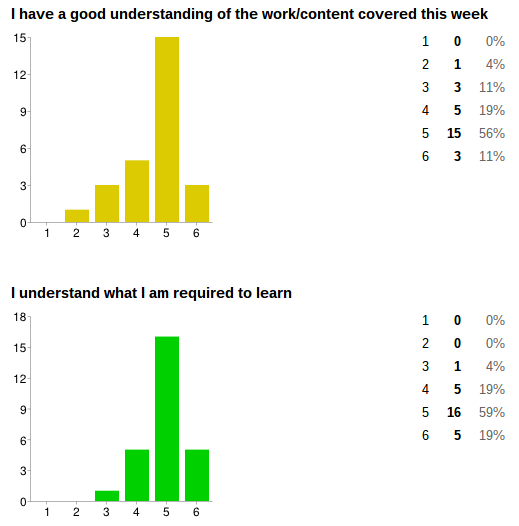
2. The students were lower on their level of understanding of the content than I had hoped, but they were confident in knowing what they were required to learn which was positive (see the second and third graphs below)
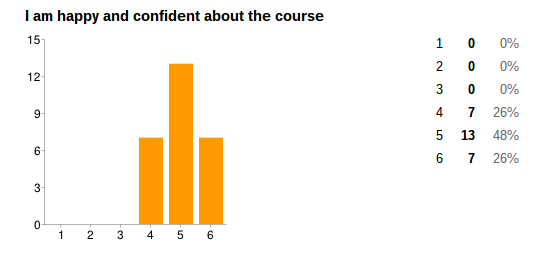
3. The students scored best on the question about their confidence/happiness scale about the course, so at least they enjoyed it/me (bottom graph)
From this data I changed how I structured the teaching the next week to reduce the amount of time I talked and attempted to increase the students' engagement. I am interested to see if this changes their level of engagement (in the next evaluation).
Where to from here?
1. I need to learn how to get the most out of Google Spreadsheets including analysing the data by weeks and by students. (Any suggestions on this very welcome.)
2. I want to use the student comments as revision or discussion points in the following week
3. I want to work out how to react to the data I collect.
to be continued...
1. I was not totally happy with how I taught in the first week as I thought I did too much talking/directed teaching and the data reflected this with many students indicating they were not engaged in the learning activities, with 50% scoring 3's and 4's (see first graph below)
2. The students were lower on their level of understanding of the content than I had hoped, but they were confident in knowing what they were required to learn which was positive (see the second and third graphs below)
3. The students scored best on the question about their confidence/happiness scale about the course, so at least they enjoyed it/me (bottom graph)
From this data I changed how I structured the teaching the next week to reduce the amount of time I talked and attempted to increase the students' engagement. I am interested to see if this changes their level of engagement (in the next evaluation).
Where to from here?
1. I need to learn how to get the most out of Google Spreadsheets including analysing the data by weeks and by students. (Any suggestions on this very welcome.)
2. I want to use the student comments as revision or discussion points in the following week
3. I want to work out how to react to the data I collect.
to be continued...
Sample graphs of data from the first reflection
 RSS Feed