I am interested in tracking student learning based on what they think and feel about their learning, rather that just on what I see, observe or mark. My aim is to analyse this data to identify students at risk, eg disengaged, overwhelmed, struggling or bored and to change and adapt the learning and activities to meet individual student needs = Learning Analytics.
In Term 1, I used a Google Form to collected weekly data from my students on their learning progress in my Year 11 Software Design and Development class. I wrote the post Trying Learning Analytics on how I designed and set up the feedback.
My reflections and general impressions
I now have data for Term 1, including 132 entries over 9 weeks from 18 different students. I have been able to change and adapt to address individual student needs or issues based on their weekly feedback. I also have enough data from the term to analyse for learning trends or issues for the whole class, comparing the classes' reactions to different activities and learning tasks and how and what I teach.
I have found getting students to complete a weekly reflective feedback has been a great way to get them to reflect on their learning, to think about what and how they are learning and to empower them to influence what and how they learn.
Data analysis
When I started collecting the data I did not know how I was going to analyse the data.
I read over each week's responses, to get an overall impression about that week's learning to check if it correlated to my impression of the learning. I also looked for individual student difficulties, issues or needs that I could address the next week. I particularly found the open response questions useful:
I wanted to analyse the whole class set of data and look for trends, so I played around with all the responses that could automatically go into a Google Spreadsheet. It was extremely easy to see a summary of the all data collected using "Show summary or responses". This creates a graph for each question and collated all the written responses together. I found it difficult using Google Spreadsheet to drill down into the data, to filter and summarise the data by week, student or question.
Fusion Tables
During the term I stumbled upon Google Fusion tables, which seemed to have the tools to analyse and visualise the data I was collecting. Google was also running a MOOC, "Making sense of data" on how to use Fusion tables, so I enrolled and I even finished! (In the process achieving one of my goals of the year, to participate in a MOOC!)
I imported the data into a Fusion table, I had to do this a few times as I discovered I needed to clean up the data (deleting blank entries, fixing up student names to be exactly the same etc).
In the Fusion table I was able to collate and summarise the data by the week or by student and create a graphical representation of particular questions. I initially focused on the first 3 questions:
Below are 2 samples of the graphs I created:
In Term 1, I used a Google Form to collected weekly data from my students on their learning progress in my Year 11 Software Design and Development class. I wrote the post Trying Learning Analytics on how I designed and set up the feedback.
My reflections and general impressions
I now have data for Term 1, including 132 entries over 9 weeks from 18 different students. I have been able to change and adapt to address individual student needs or issues based on their weekly feedback. I also have enough data from the term to analyse for learning trends or issues for the whole class, comparing the classes' reactions to different activities and learning tasks and how and what I teach.
I have found getting students to complete a weekly reflective feedback has been a great way to get them to reflect on their learning, to think about what and how they are learning and to empower them to influence what and how they learn.
Data analysis
When I started collecting the data I did not know how I was going to analyse the data.
I read over each week's responses, to get an overall impression about that week's learning to check if it correlated to my impression of the learning. I also looked for individual student difficulties, issues or needs that I could address the next week. I particularly found the open response questions useful:
- "What do you think you were expected to learn this week?"
I liked this question as it was one of the best to help determine a student's progress and level of understanding. It showed what they thought was important that week and what they needed to know and understand. - "Do you require more help, support or have questions?"
I gained some great feedback from this question, it included critical feedback about the learning activities, or concepts they did not understand. I used the feedback to adapt the learning and activities to address particular student's needs or questions.
I wanted to analyse the whole class set of data and look for trends, so I played around with all the responses that could automatically go into a Google Spreadsheet. It was extremely easy to see a summary of the all data collected using "Show summary or responses". This creates a graph for each question and collated all the written responses together. I found it difficult using Google Spreadsheet to drill down into the data, to filter and summarise the data by week, student or question.
Fusion Tables
During the term I stumbled upon Google Fusion tables, which seemed to have the tools to analyse and visualise the data I was collecting. Google was also running a MOOC, "Making sense of data" on how to use Fusion tables, so I enrolled and I even finished! (In the process achieving one of my goals of the year, to participate in a MOOC!)
I imported the data into a Fusion table, I had to do this a few times as I discovered I needed to clean up the data (deleting blank entries, fixing up student names to be exactly the same etc).
In the Fusion table I was able to collate and summarise the data by the week or by student and create a graphical representation of particular questions. I initially focused on the first 3 questions:
- I was highly engaged in learning this week
- I was highly involved in all activities this week
- I have a good understanding of the work/content covered this week
Below are 2 samples of the graphs I created:
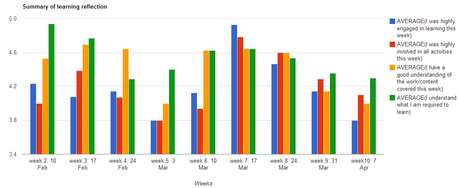
1. The first graph shows all student responses for the first 3 questions, summarised by week (click here to see the fusion graph).
Some analysis/questions from this graph:
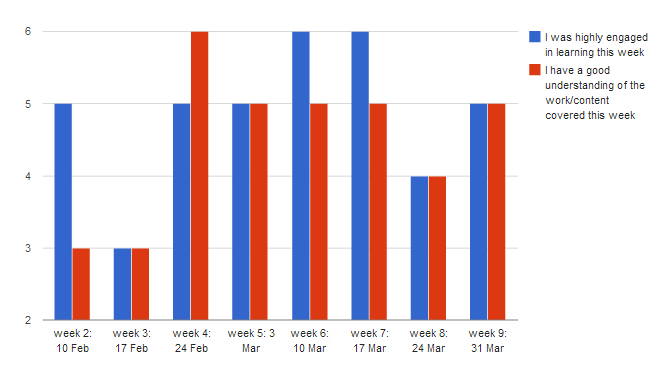
2. The second graph shows an individual student's response for 2 of the questions over the term. I was able to look at this graph for each student.
Some analysis/questions from this graph:
- Students did not seem as engaged in Week 5. This week was the end of a topic and I feel I did too much teacher centric teaching
- Week 7 stood out as a week students were engaged. In this week I started some practical work and I did less whole class discussions
- I was extremely explicit at the start of the course about what was expected, I need to make sure I am that explicit every week about the expectations
- After Week 7, student responses trended down to the end of the term. They were working on the same topic over those weeks which included lots of practical activities. There was more time in these classes allocated to student centred, free time to complete these activities.
2. The second graph shows an individual student's response for 2 of the questions over the term. I was able to look at this graph for each student.
Some analysis/questions from this graph:
- There was an issue with the student's understanding of the work in weeks 2 and 3, it would be interesting to check their level of understanding of this work
- This student enjoyed the more practical activities and learning in weeks 6 and 7
- The activities and content were very different in weeks 2-3 and 6-7, so it looks like this student enjoys the more hands on practical activities done in weeks 6-7.
So many questions
When I started this journey I had many questions, I still don't have answers but I have some ideas. Some of the questions that still drive me include:
- What data best shows student progress, especially students at risk (disengaged, struggling, bored)
- How do I analyse the data?
- What do I do with the data and analysis once I have it?
- How can I give students access to their data so they can see and monitor their own progress?
- How can data about students' progress influence the teaching and learning?
- Can I scale this up for all teachers/learners in a school?
Where to from here?
I am continuing to collect student weekly feedback in Term 2. I have updated some of the questions, including adding their email addresses and removing some of the questions that did not seem to collect relevant data. (see Term 2 form)
I am going to give feedback to students on their Term 1 data and investigate ways for students to see their own Term 2 data.
I will continue to investigate and trial ways to use the data to adjust the learning for individual students.
Do you have suggestions or ideas how I could improve the collection or analysis of the data?
 RSS Feed